Rainfall Monitoring
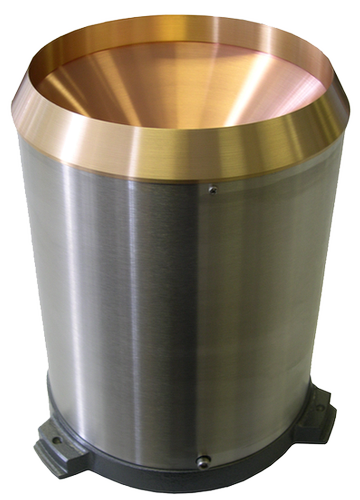
Tipping bucket rain gauges installed alongside flow meters, so every change in the network can be read against the rain that caused it.
At a glance
- RIMCO 7499 gaugesTipping buckets sited in the catchment
- Every 1 to 5 minutesSo storm peaks are captured
- Inflow from infiltrationRapid response separated from slow groundwater
- Bureau of Meteorology loggersDeveloped by EDS in the 1990s, still in use
Flow data shows that something changed. Rainfall data shows why. EDS integrates data from RIMCO 7499 tipping bucket rain gauges sited in the catchments we monitor, so the network’s wet weather response can be measured against the rain that produced it.
Rainfall correlation is how inflow is told apart from infiltration. Inflow arrives quickly during a storm. Infiltration builds slowly and lingers as groundwater rises. On-site gauges, read with historical climate data, let the two be separated with confidence.
Rainfall data is in our history: EDS developed the data logger for the Bureau of Meteorology in the 1990s, and those loggers are still in use today.
What is included
Results from the field
Twenty short term flow meters and on-site rain gauges showed three subcatchments carried 65% of the I&I. Capital went into relining and inflow reduction instead, and peak wet weather flows fell 35% within two years.
High resolution sewer flow and rainfall monitoring, giving the utility the data it needed for infrastructure planning and management.
4 more results from EDS programs
- 34sites installed and operated in 12 weeks
- 24 huntil flows were back at baseline after relining
- 40%less variation in depth and flow during rain
- 30%less spent on unnecessary relining
Applications
- Inflow and infiltration studies
- Hydraulic model calibration in dry and wet weather
- Wet weather overflow risk
- Environmental monitoring programs
How a program runs
From the first call to data you can act on.
- 01
Scope and site selection
Agree what the data has to answer, then choose sites by their hydraulics, not their convenience.
- 02
Install and commission
Trained EDS crews install intrinsically safe instruments, Australia wide, and check every site before it goes live.
- 03
Monitor and validate
Readings arrive over 4G into FlowSense, with continuous QA/QC and alarms when something changes.
- 04
Report and recommend
Validated data and a report that shows where the problems are and what to fix first, or a feed into your model by API.
Talk to the people who measure it.
Tell us about your network, site or project. A real person from our team will come back to you.